Gemany Cars
For Sale

Introduction:
- PBS Automobile Handler, a prominent car dealer in Germany with 20 years of experience, is venturing into the online market to tap into the growing online auto dealership sector. To strategize for this new chapter, PBS Automobile Handler aims to analyze the online marketplace landscape, focusing on AutoScout24, a leading platform for buying and selling cars and other vehicles.
Objectives :

- The original dataset contains 251,079 rows and 15 columns.
- Since the dataset comprises scraped data from the AutoScout24 website,
- it is evident that there are several areas requiring cleaning and preprocessing.
- The missing values have been provided in the table .
- For the fuel consumption which has most missing values ,I tried first to replace missing values with the values of exact same models to reduced the missing values.
- Same approach has been used for Horse Power.
- For the missing values in the mileage I decided to use 0 instead and dropped remaining values.
- Moreover like any other scraped dataset we faced a lot of mixed values, as shown in the following table, which needed be detected and dropped.
- It was a bit challenging for me to see so many mixed data types , because it was my first time working with scaped data.
- But I have tried to go step by step further and choose the right way to minimalize the dropped values.
- Transmission values have been categorized into two types: Automatic and Manual. Semi-automatic values are also considered as Automatic.
- The following table displays missing values identified after addressing mixed data types.
- The rare models (less than 10) have been also omitted from the dataset.
- After cleaning process the new dataset has 238,633 rows and 11 columns.
- Japan with 8 car brands has the most brands , following by Germany.
- We need to consider that two brands , Seat and Skoda are also owned by German companies.
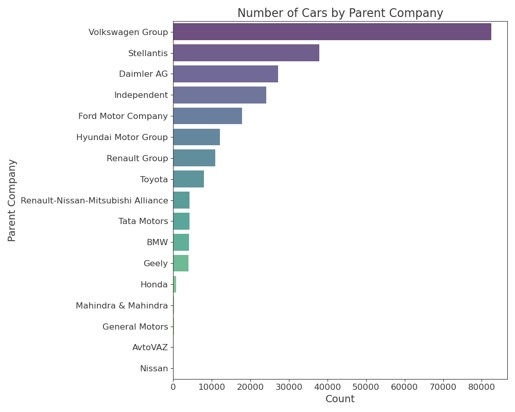
- The Treemap above shows the different brans and their share of the market.
- I also included the parent company of the brands. It is evident that the Volkswagen Group holds a relatively dominant position.
- The strongest correlation is between mileage and age of the car .
- The second strongest is relation is between price and Horse Power.
- If the car has more power it would be more expensive.
- In this pair plot we see the relations between different values.
- The scatterplot also supports our hypothesis and shows that the Horse power and price have a strong relation.
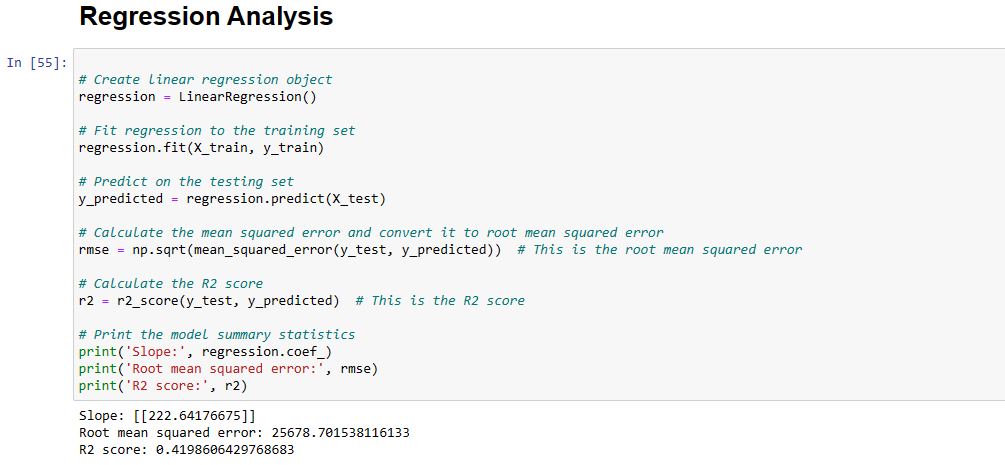
- The outcome of the regression analysis does not support our hypothesis, indicating a significant discrepancy between the predicted and actual values of the price. This suggests that additional factors may be influencing the results, necessitating a more detailed analysis to identify these components.
- The first try to fit the regression model was not successful Although my codes where correct in that part, there was something wrong in the other parts .After some research on the internet and getting some help from stack Flow and AI , I could successfully fit the regression model.
- Targeted Marketing Strategies: Based on the clustering analysis, marketing efforts can be more effectively directed. For example, vehicles in Cluster 2 - newer, higher-priced cars with low mileage - can be marketed to consumers looking for almost new vehicles without the brand-new price tag. Conversely, vehicles in Cluster 1 offer opportunities for targeting budget-conscious consumers interested in older models.
- Inventory Management: Dealerships could adjust their inventory to match the profiles of the most common clusters in their region. For instance, if Cluster 3 vehicles are prevalent in the market, stocking up on older, moderately priced cars with reasonable power and high mileage might meet consumer demand more effectively.
- Pricing Strategy: Insights from the clusters can help in setting competitive prices. Vehicles in Cluster 0, being very high-priced and high-powered, might allow for a premium pricing strategy, while those in Cluster 1 might require more competitive pricing to attract buyers looking for economical options.
- Data Quality:
Data Quality and Completeness: As the analysis is based on scraped data, it's subject to the limitations inherent in such data, including potential inaccuracies, missing values, and biases in the data collection process. The insights derived should be seen as indicative rather than definitive.
- Generalizability:
The findings are specific to the dataset and the time period from which it was collected. While the clustering provides useful insights, they may not be universally applicable across different geographic regions or market segments.
-
Data Cleaning Techniques: Learn to handle missing values, mixed data types, and outliers effectively for accurate analysis.
-
Data Exploration and Visualization: Enhance skills in exploring data geographically and using visualizations like treemaps and correlation matrices.
-
Feature Engineering: Understand how to create new features from existing data to improve analysis and model performance.
-
Regression Analysis: Gain experience in selecting and interpreting regression models to predict car prices based on various features.
-
Cluster Analysis: Implement clustering algorithms to group cars based on characteristics like price, age, power, and mileage, providing insights into market segmentation.
Dataset:
Germany Used Cars Dataset 2023 from Kaggle.com
Data Cleaning:
Missing values:
Mixed data types:
Data Exploration
I have tried to give the data some geographical aspects with adding the countries of car producers to the dataset.


Correlation:
Analysis

Regression Analysis:

Challenges:
Cluster Analysis:

Cluster 3
Count: 73,200 cars
Price: Moderate (mean: €16,037.79, median: €14,486.50)
Age: Older (mean: 9.43 years, median: 9 years)
Power: Average (mean: 148.71 PS, median: 140 PS)
Mileage: High (mean: 117,949.43 km, median: 106,500 km)
This cluster likely represents older, moderately priced cars with high mileage, indicating they are well-used but maintained an average power level. The moderate price points to a market for used, reliable vehicles.
Cluster 2
Count: 110,108 cars
Price: Higher (mean: €27,930.56, median: €24,990)
Age: Newer (mean: 3.66 years, median: 4 years)
Power: Average to slightly below average (mean: 149.70 PS, median: 150 PS)
Mileage: Low (mean: 38,050.73 km, median: 28,500 km)
This cluster appears to consist of relatively new, higher-priced cars with lower mileage, suggesting they are likely newer models that have retained much of their value and have not been heavily used.
Cluster 1 : Count: 36,472 cars
Price: Lower (mean: €8,069.62, median: €5,500)
Age: Very Old (mean: 17.70 years, median: 17 years)
Power: Average (mean: 146.25 PS, median: 136 PS)
Mileage: Very High (mean: 180,408.40 km, median: 173,000 km)
Vehicles in this cluster are characterized by their very old age, low price, and very high mileage. These are likely economy or older vehicles that have been significantly depreciated over time.
Cluster 0 :Count: 18,412 cars
Price: Very High (mean: €83,153.54, median: €56,870)
Age: Newer (mean: 5.74 years, median: 6 years)
Power: High (mean: 420.02 PS, median: 392 PS)
Mileage: Moderate (mean: 60,064.72 km, median: 50,000 km)
This cluster is distinct for its very high price and high power vehicles, which are relatively new and have moderate mileage. This group likely includes luxury, high-performance, or premium cars that are sought after for their brand, performance, and features rather than practicality.
Recommendations:
Limitations:
Technical lessons:
Thanks for reviewing this Analysis, if you would like to see more details please visit its GitHub Repository.