Instacart
Analysis
ABOUT DATASET
- The online grocery industry, exemplified by Instacart, is experiencing remarkable growth. This project is focused on conducting preliminary data exploration and analysis using selected Instacart datasets. Our aim is to extract insights and devise segmentation strategies aligned with specific criteria.
- Python serves as a powerful tool in this endeavor, enabling us to wrangle data, ensure consistency, and create impactful visualizations. Through these methods, we aim to reveal actionable insights and tailor segmentation to fulfill Instacart's needs effectively.
Challenges:

- Managing a dataset of this scale, with over 30,000,000 rows and a volume exceeding 3GB,
presented significant hurdles.
- As a junior data analyst, I encountered difficulties such as handling numerous missing values and memory errors. Learning to effectively manage memory usage was crucial to prevent errors and potential loss of data and time.
Objectives:
- Conduct an initial data and exploratory analysis of select data sets from Instacart to extract insights and propose segmentation strategies aligned with specified criteria.
Key Points:
- Order intervals among different loyalty groups.
- Ordering habits among different regions.
- Orders volume among different family statuses and different age groups.
Dataset:
- The Instacart Online Grocery Shopping Dataset 2017 Customers Data Set.
Tasks & Utilities:
- Structuring Python code within Anaconda using Jupyter Notebooks.
- Data wrangling for cleaning and preparing datasets.
- Implementing consistency checks for data quality.
- Merging and combining diverse datasets.
- Deriving new variables to enhance analysis.
- Crafting customer profiles based on data.
- Creating Python visualizations for enhanced data representation.
Data Exploration & Analysis:
Now let us dive into the data and see what interesting insights can be found in it.


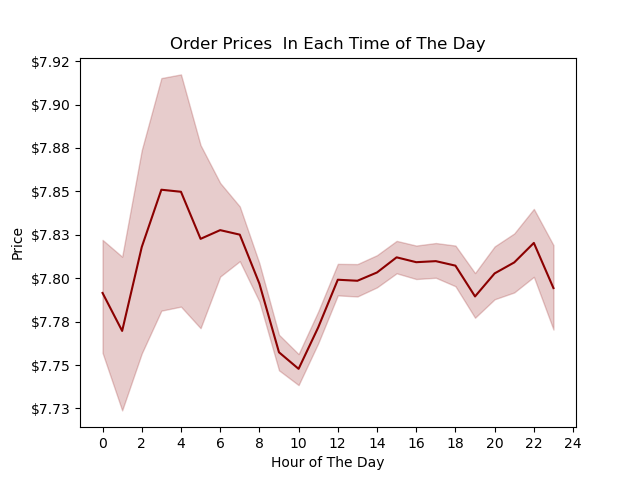
Left: Here, we observe variations in order prices across different hours of the day. Notably, customers tend to spend more around 2 o'clock.
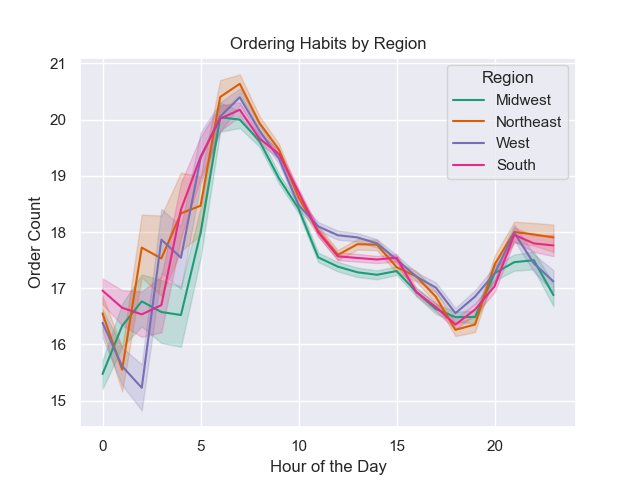
Right: The order count fluctuates throughout the day, varying from hour to hour. This graph illustrates the diverse ordering habits among different regions.
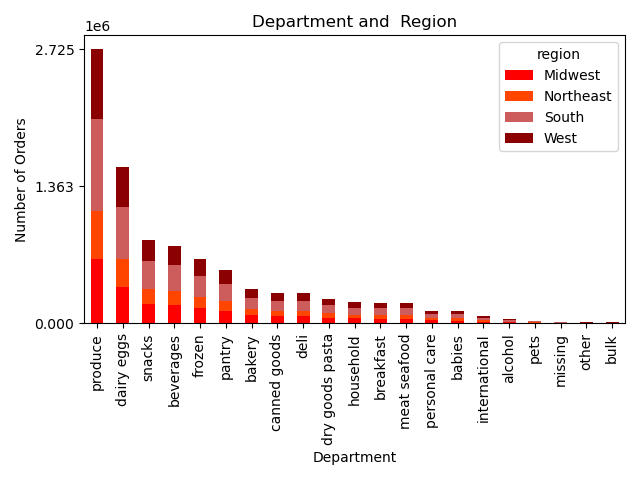
- In order to visualize the departments popularity among regions, I needed first to inject the departments name to the dataset.
As depicted in the scatterplot above, it is evident that the highest density of income falls within the range of less than 200k. Additionally, there is a smaller proportion of individuals under the age of 40 with incomes ranging between 200k and 400k. Lastly, it is notable that individuals over the age of 40 occupy the income range above 400k.
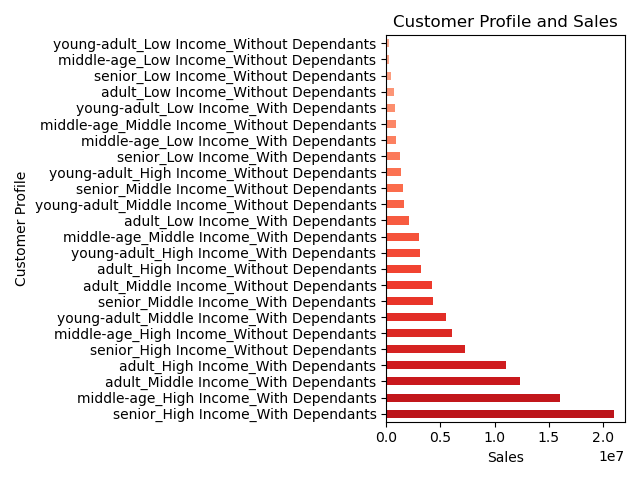
- Target high income customers with dependents for key marketing efforts, as shown in the chart.
- Tailor promotions to preferences, maintain consistent orders, and introduce loyalty programs for sustained engagement and revenue.
- Leverage the correlation between age, family status, and ordering habits to target married seniors and adults in marketing efforts.
- Optimize regional marketing by prioritizing promotions in each region.
- Acknowledge ordering habit variations in customer loyalty ; engage loyal customers with shorter intervals through personalized promotions and rewards.
-
Handling Large Datasets: Managing datasets with millions of rows and gigabytes of data requires effective memory management and optimization techniques to prevent errors and ensure smooth analysis.
-
Data Wrangling and Cleaning: Dealing with missing values, ensuring data consistency, and merging diverse datasets are essential skills for preparing data for analysis and deriving meaningful insights.
-
Exploratory Data Analysis (EDA): Conducting EDA reveals patterns and trends in the data, such as variations in order prices and order counts across different hours of the day or regions, providing valuable insights for segmentation strategies.
-
Data Visualization: Creating visualizations using Python helps in representing data effectively and communicating insights, such as department popularity among regions or the relationship between age and income.
-
Segmentation Strategies: Understanding customer profiles based on data and tailoring marketing efforts and promotions accordingly can optimize engagement, revenue, and customer loyalty. Leveraging correlations between demographics and ordering habits can inform targeted marketing strategies for different customer segments.
Departments Popularity Among Different Regions

Is There Any Relation Between Age and Income?

Experience:
Gaining proficiency in creating samples for large datasets proved invaluable in reducing time costs and preventing errors.
Recommendations:

Technical lessons:
Thanks for reviewing this Analysis, if you would like to see more details please visit its GitHub Repository.